 - Beta")
Eye tracking representation
Eye tracking is a research method, which involves tracking the eye movements during perception and processing of information received visually. The eye movements are observable through infrared light, the scanner of which is placed under the monitor. The reflection of these beames are registered by a special camera (eye movement is measured by the change in the amount of reflected light), and the collected data are transmitted to a computer that analyzes them. The camera installed at the top of the monitor or as the integral part of the monitor records the behaviour and reactions of the proband.
Then recordings of eye movements allow us to create (using special software) heat maps, scan paths and statistical charts.
Heatmaps are graphical representation of attention directed at the test component in the heat distribution. On this maps we can see the elements noticed by the proband, and also także elementy the elements omitted by them during visual scanning. The software can generate different types of maps:
- Black and white heat maps (focus maps) - their level of transparency shows the intensity of attention directed at a particular component. In other words, the brighter area on the map, the higher the level of intensity of attention:

Focus map
- Coloured heat maps - they provide a lot more information (from the perspective of the text analysis), because the level of intensity of colours shows the level of intensity of attention directed at the particular parts of the text. The more red the area, the higher/ longer was the intensity of attention directed at the part of the text. During eye tracking studies we can generate heat maps previously specyfying parameters/ criteria that are the most important for our study: (a) total numbers of fixations, (b) total fixation time, (c) relative fixation time:
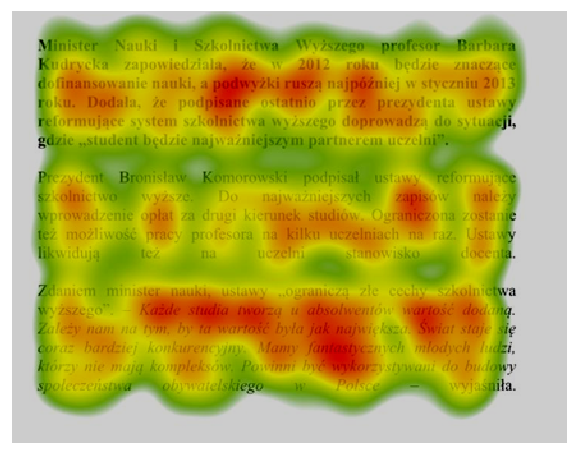
Coloured heat map
The eye tracker shows not only fixations - the points on which the the eye movement are stopped, but also saccades, i.e. the eye movements when the eyes are moving from one point to another - „paths" between following fixations. The we get the gazeplot map = the scan path (path of sight). Circles illustrate the lenght of fixation, the bigger the circle, the longer the fixation on the particular component. The numbers show the sequence of fixations:
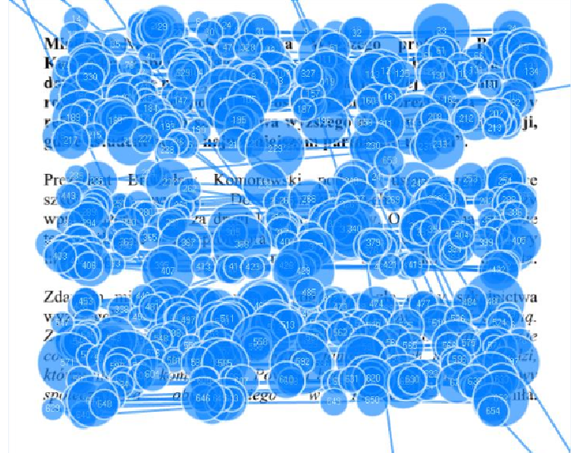
Gaze plot map
Moreover, the results of eye tracking research can be presented in the form of statistical charts, figures and tables. However, it is possible after the preparation of research material. Eye tracking studies on the texts require prior identyfying and selection of AOIs = Areas of Interest. This makes it possible to confront selected areas:
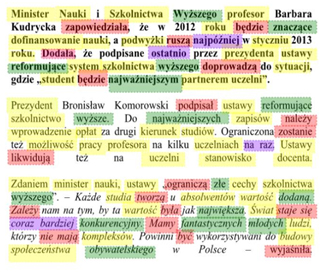
Selected areas of interest
By selecting the areas of interest the software can collate particular areas, taking into account selected areas, for example, the lenght of fixations on particular parts in comparison with the frequency of their occurance, the number of fixation on particular parts etc.:
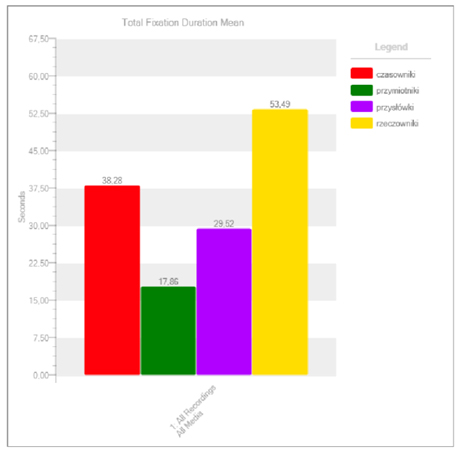
Statistical chart
The eye tracker also makes it possible to do the audio recordings, for example, of the text translation. It allows us to verify the lenght of fixations and the quality of interpreting and the accuracy of selected equivalents. Devices with integrated camera or a camera installed on the monitor also allow us to do a video recording of movements and behaviour of the proband during the experiment.
[source: M. Płużyczka, 2012,
Na co patrzy, a co widzi tłumacz a vista? Translatoryczne możliwości poznawcze okulografii,
(in:) Lingwistyka Stosowana/ Applied Linguistic/ Angewandte Linguistik 5, 66-77]